Patient Segmentation & Quality Patient Care
As the need for quality and cost-effective patient care increases, healthcare providers are increasingly focusing on data-driven diagnostics while continuing to utilize their hard-earned human intelligence. Simply put, data-driven healthcare is augmenting the human intelligence based on experience and knowledge.
Segmentation is the standard technique used in Retail, Banking, Manufacturing, and other industries that needs to understand their customers to provide better customer service. Customer segmentation defines the behavioural and descriptive profiles of customers. These profiles are then used to provide personalized marketing programs and strategies for each group.
In a way, patients are like customers to healthcare providers. Though the element of quality of care takes precedence than profit-making intention, a similar segmentation of patients will immensely benefit the healthcare providers, mainly for the following reasons:
- Customizing the patient care based on their behaviour profiles
- Enabling a stronger patient engagement
- Providing backbone for data-driven decisions on patient profile
- Performing advanced medical research like launching a new vaccine or trial
The benefits are obvious and individual hospitals may add more points to the above list; the rest of the article is about how to perform the patient segmentation using data mining techniques.
Data Mining for Patient Segmentation
In Data Mining a, segmentation or clustering algorithm will iterate over cases in a dataset to group them into clusters that contain similar characteristics. These groupings are useful for exploring data, identifying anomalies in the data, and creating predictions. Clustering is an unsupervised data mining (machine learning) technique used for grouping the data elements without advance knowledge of the group definitions.
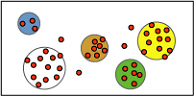
K-means clustering is a well-known method of assigning cluster membership by minimizing the differences among items in a cluster while maximizing the distance between clusters. Clustering algorithm first identifies relationships in a dataset and generates a series of clusters based on those relationships. A scatter plot is a useful way to visually represent how the algorithm groups data, as shown in the following diagram. The scatter plot represents all the cases in the dataset, and each case is a point on the graph. The cluster points on the graph illustrate the relationships that the algorithm identifies.
One of the important parameters for a K-Means algorithm is the number of clusters or the cluster count. We need to set this to a value that is meaningful to the business problem that needs to be solved. However, there is good support in the algorithm to find the optimal number of clusters for a given data set, as explained next.
To determine the number of clusters for the algorithm to use, we can use a plot of the within cluster’s sum of squares, by number of clusters extracted. The appropriate number of clusters to use is at the bend or ‘elbow’ of the plot. The Elbow Method is one of the most popular methods to determine this optimal value of k i.e. the number of clusters. The following code creates a curve.
from sklearn.cluster import KMeans
wcss = []
for i in range(1, 20):
  kmeans = KMeans(n_clusters = i, init = 'k-means++', random_state = 42)
  kmeans.fit(customer_data[columns])
  wcss.append(kmeans.inertia_)
plt.plot(range(1, 20), wcss)
plt.title('The Elbow Method')
plt.xlabel('Number of clusters')
plt.ylabel('WCSS')
plt.show()
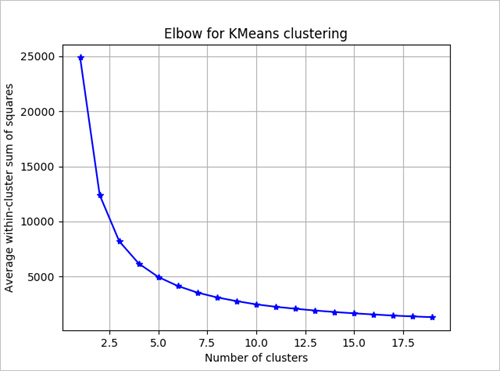
In this example, based on the graph, it looks like k = 4 would be a good value to try.
Reference Patient Segmentation Using K-Means Algorithm in GAVS Rhodium Platform
In GAVS Rhodium Platform, which helps healthcare providers with Patient Data Management and Patient Data Sharing, there is a reference implementation of Patient Segmentation using K-Means algorithm. The following are the attributes that are used based on a publicly available Patient admit data (no personal information used in this data set). Again in the reference implementation sample attributes are used and in a real scenario consulting with healthcare practitioners will help to identify the correct attributes that is used for clustering.
To prepare the data for clustering patients, patients must be separated along the following dimensions:
- HbA1c: Measuring the glycated form of hemoglobin to obtain the three-month average of blood sugar.
- Triglycerides: Triglycerides are the main constituents of natural fats and oils. This test indicates the amount of fat or lipid found in the blood.
- FBG: Fasting Plasma Glucose test measures the amount of glucose levels present in the blood.
- Systolic: Blood Pressure is the pressure of circulating blood against the walls of Blood Vessels. This test relates to the phase of the heartbeat when the heart muscle contracts and pumps blood from the chambers into the arteries.
- Diastolic: The diastolic reading is the pressure in the arteries when the heart rests between beats.
- Insulin: Insulin is a hormone that helps move blood sugar, known as glucose, from your bloodstream into your cells. This test measures the amount of insulin in your blood.
- HDL-C: Cholesterol is a fat-like substance that the body uses this as a building block to produce hormones. HDL-C or good cholesterol consists primarily of protein with a small amount of cholesterol. It is considered to be beneficial because it removes excess cholesterol from tissues and carries it to the liver for disposal. The test for HDL cholesterol measures the amount of HDL-C in blood.
- LDL-C: LDL-C or bad cholesterol present in the blood as low-density lipoprotein, a relatively high proportion of which is associated with a higher risk of coronary heart disease. This test measures the LDL-C present in the blood.
- Weight: This test indicates the heaviness of the patient.
The above tests are taken for the patients during the admission process.
The following is the code snippet behind the scenes which create the patient clustering.
columns = [ "creatinine",
"glucose",
"sodium",
"hematocrit",
"respiration",
"pulse",
"bloodureanitro",
"neutrophils",
"lengthofstay"]

n_clusters = 4
means_cluster = sk_cluster.KMeans(n_clusters=n_clusters, random_state=111)
kmeans = KMeans(n_clusters = 4, init = 'k-means++', random_state = 42)
The below is the output cluster created from the above algorithm.
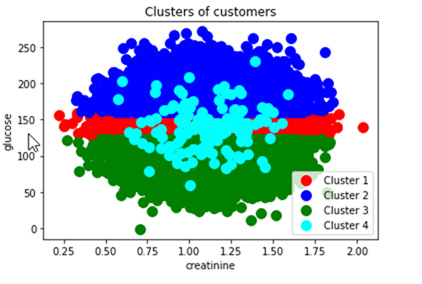
Just from this sample, healthcare providers can infer the patient behaviour and pattens based on their creatinine and glucose levels, in real life situations other different attributes can be used.
AI will play a major role in future healthcare data management and decision making and data mining algorithms like K-Means provide an option to segment the patients based on the attributes which will improve the quality of patient care.
About the Author –

Srinivasan Sundararajan
Srini is the Technology Advisor for GAVS. He is currently focused on Data Management Solutions for new-age enterprises using the combination of Multi Modal databases, Blockchain and Data Mining. The solutions aim at data sharing within enterprises as well as with external stakeholders.
Back to blogs